WorkBreak – See Your Time!
What takes up too much of your time? Clear visualization of time spent doing anything lets you see the problem and helps you concentrate more on what really matters. Create timers for everything you do and then see a chart of time spent.
Statistics
In-App purchase removes ads and adds several new pie charts: time spent by all the days, weeks and months.
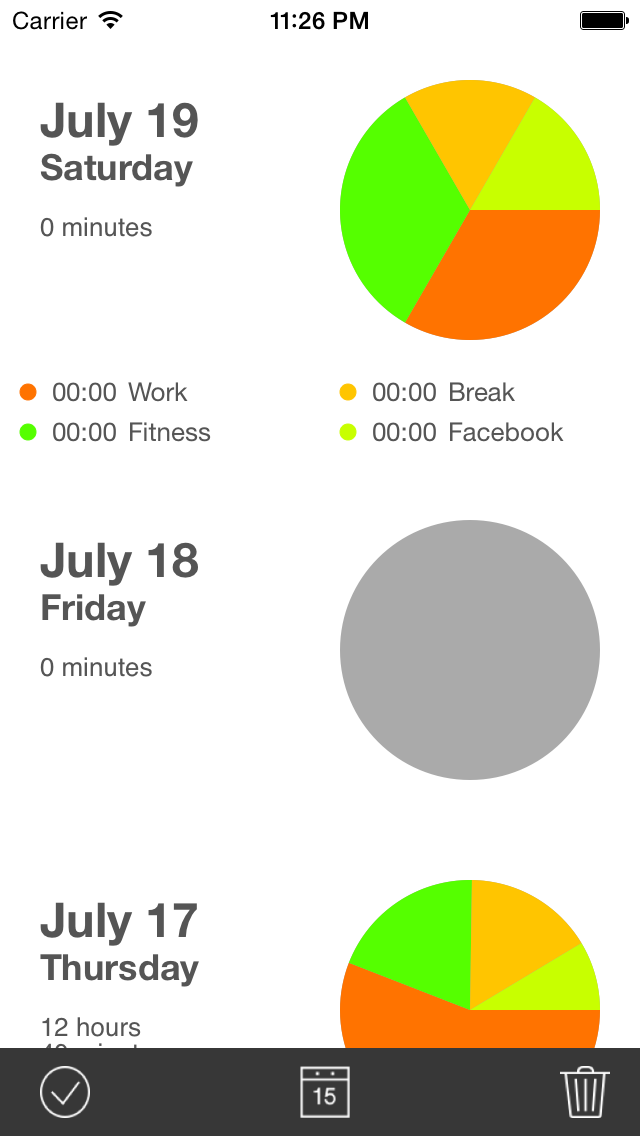
Days Chart
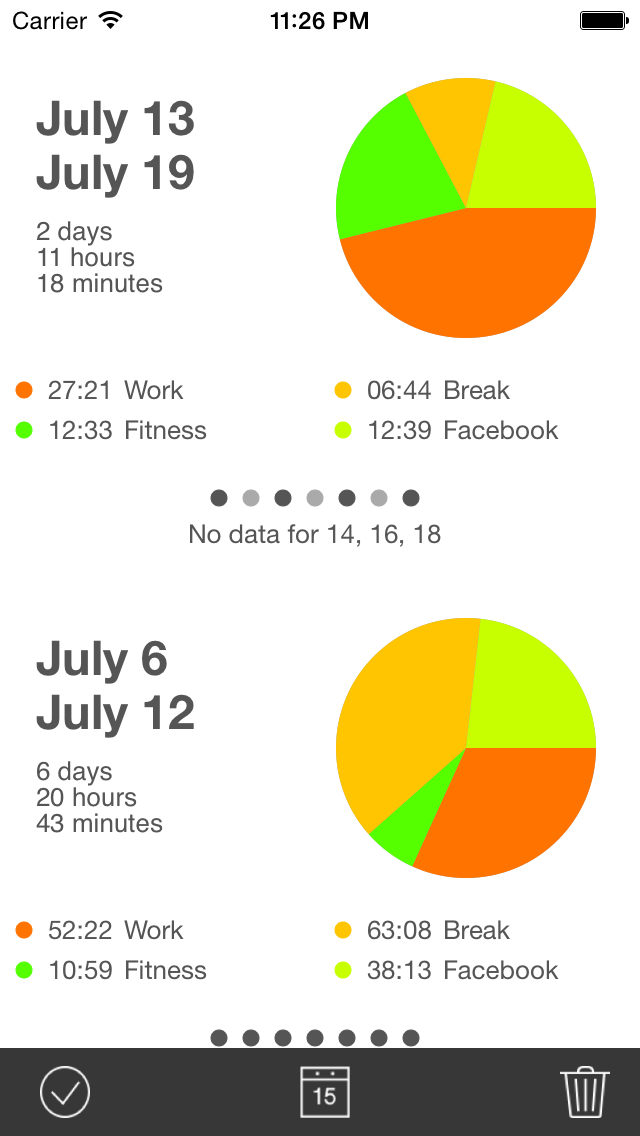
Weeks Chart
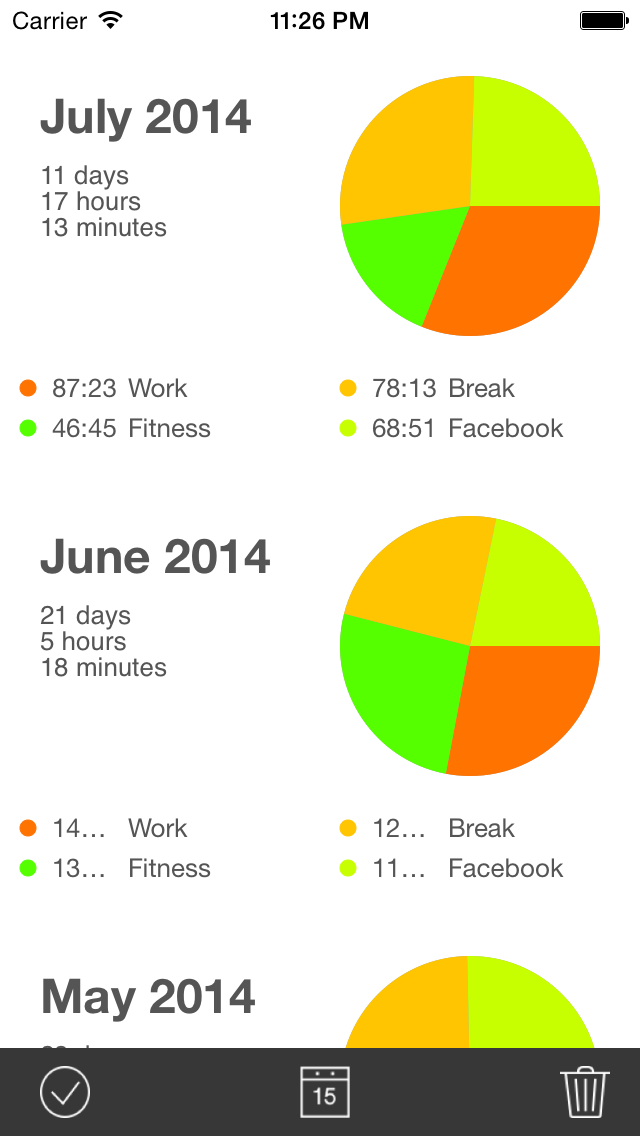
Months Chart